The Great Shake-Up 2025/26
Are You Local Enough?
Benchmarks every multi-location brand needs to drive location performance in the AI era.
Discover how brands in your industry are adapting to the biggest shifts in location marketing. This report reveals the benchmarks, gaps, and opportunities shaping multi-location success in 2025/26.


The way consumers search & choose local businesses has entered a new era.
For years, success meant ranking high on Google and driving clicks through conventional SEO practices. While that model still plays an important role, it is insufficient for today’s consumer journey.
Consumers now discover businesses everywhere: on search engines, social platforms, maps, and apps, and increasingly through AI-driven systems like Google AI Overviews, ChatGPT, and Perplexity. These platforms deliver instant, answer-first recommendations, replacing linear funnels with fragmented journeys.
This is the Great Shake-Up.
What makes this shift so disruptive is that AI and traditional search are converging. People expect speed, trust, and relevance, no matter the platform. Marketing teams can no longer work in silos; every signal matters, whether it’s accurate data, fresh reviews, visible engagement, or seamless ways to convert. Together, these signals amplify one another, creating outcomes greater than the sum of their parts for the brands that get it right.


For multi-location leaders, the questions are urgent.
Are our locations discoverable in AI-powered search?
Do people trust our brand enough to choose us over the competition?
How do our results compare with peers & leaders in our industry?
Over 51,000 locations across 500+ multi-location brands worldwide.
This report provides answers.
Drawing on aggregated, anonymized data from over 51,000 locations across 500+ multi-location brands worldwide in H1 2025, it benchmarks performance across the four pillars that now define local success: visibility, reputation, engagement, and conversions. The findings reveal what top performers are doing differently, where industries are falling short, and which opportunities offer the biggest gains.
The message is clear: location performance is now a decisive advantage. Brands that embrace Location Performance Optimization (LPO) are excelling across those four pillars, building trust, earning recommendations, and driving measurable results across every channel where consumers make decisions. Use this report to see where you stand, and take the next step with our LPO certification to accelerate your progress in the era of AI discovery.
LPO -
The New Standard for Local Success


58% of consumers use generative AI for product & service discovery.
30% prefer AI-powered search results to visiting business websites.
To turn discovery into local revenue in this AI-first world, brands need Location Performance Optimization (LPO).
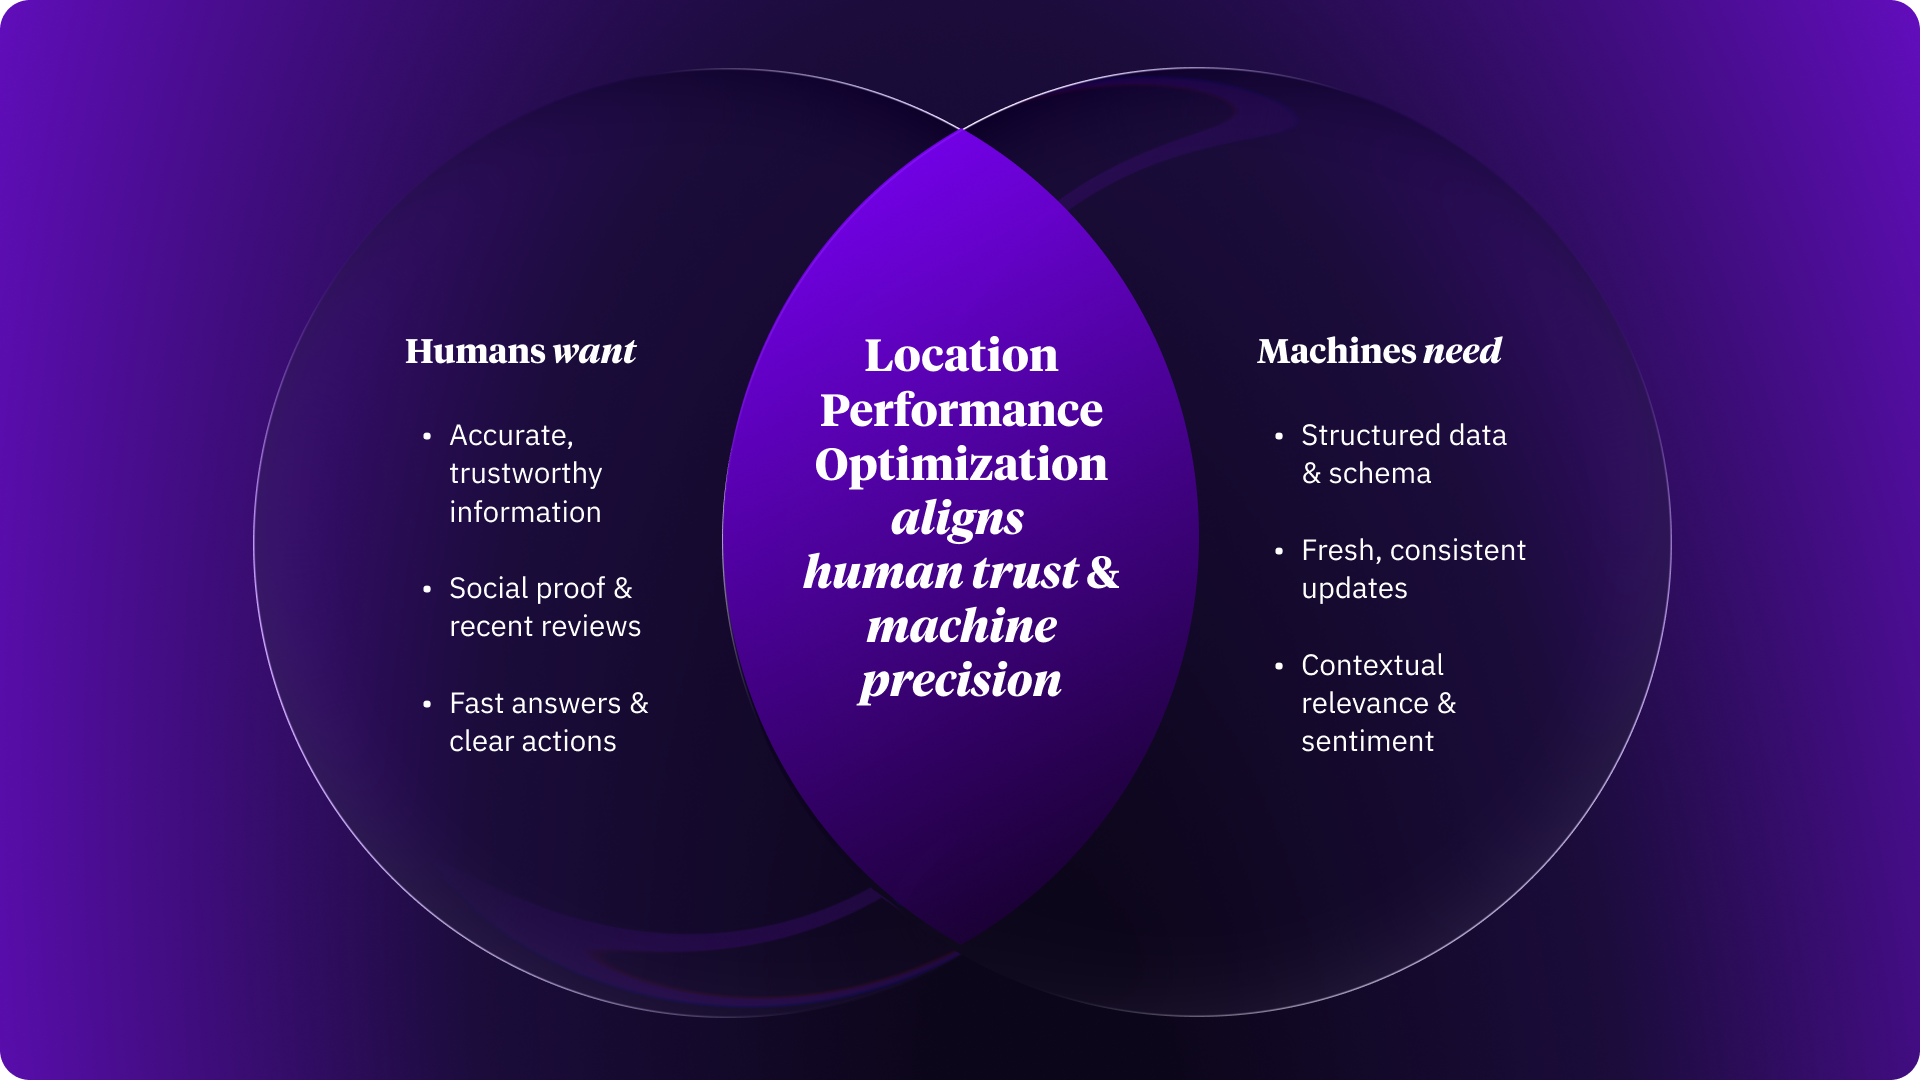
LPO incorporates and goes beyond both Search Engine Optimization (SEO) and Generative Engine Optimization (GEO) to form a complete system that aligns what people want (trust, clarity, fast answers) with what machines reward (structured, current, context-rich data).
Brands that fail to implement LPO risk becoming invisible in both traditional search & the AI-driven discovery layer.

The Four Pillars of LPO
Every successful local strategy rests on four essential pillars, which are the foundation for driving business impact and revenue at the local level.
Visibility


Reputation

Engagement

Conversion

LPO Pillar 1 | Visibility
Be discoverable everywhere your customers are searching.
Humans want clear, reliable information they can act on. Machines need structured, current data they can interpret and surface with confidence.
- Accurate, complete listings across Google, Apple, Bing, Yelp, Facebook, Instagram, and AI-powered assistants.
- Structured data and category alignment so algorithms understand your business. Include schema.org LocalBusiness types, services, products, menus, attributes, and holiday hours.
- Real-time syncing and deduplication to maintain a single source of truth that AI can cite.
- Consistent NAP, categories, and identifiers across networks to reduce ambiguity for LLMs.
Winning signals: Complete, consistent, AI-ready profiles across the web that LLMs can interpret and reference confidently


LPO Pillar 2 | Reputation
Build trust with consumers & machines.
43% said online reputation (positive reviews, high ratings) influenced their most recent visit decision. Source
Humans want to see proof of trust through authentic, positive reviews; machines need a steady flow of fresh sentiment signals to rank and recommend reliably.
- Collect reviews across key platforms and drive a consistent review cadence.
- Respond to reviews with brand-safe guidelines and fast turnaround times
- Monitor topics and sentiment to identify patterns across locations.
- Encourage first-party feedback on location pages to enrich AI summaries.
Winning signals: Fresh reviews, fast responses, and an average rating of 4.5+ stars.
LPO Pillar 3 | Engagement
Show customers & algorithms that your brand is active & relevant.
15% of consumers said that social media presence influenced their decision to visit a local business. 16% cited “social media engagement” as a top reason for revisiting a business. Source
Humans want to feel a business is active and relevant; machines need continuous, content-rich activity to confirm that relevance in results.
- Regularly upload photos, videos, and updates to your Google Business Profiles and other key directories.
- Publish location-specific content with Google Posts, Apple Showcases, social media posts, and FAQs.
- Differentiate brand-level messaging from local-level updates: Brand messaging encompasses company-wide campaigns, while local updates focus on location-specific news, offers, or events.
Winning signals: Social media profiles that feel alive and responsive. This boosts discovery in AI search and wins consumer confidence.


LPO Pillar 4 | Conversion
Make it easy for discovery to turn into action.
60% of consumers say they are likely or very likely to purchase in person after discovering a business online. Source
Humans want simple, frictionless ways to take action; machines need trackable, consistent signals that those actions are happening to keep surfacing the business.
- Add clear CTAs: Book Now, Call, Get Directions, Order Online, Sign Up.
- Create location pages that answer real customer questions.
- Track what drives action with UTM links, call tracking, and analytics.
- Resolve broken links and mismatched phone numbers promptly.
Winning signals: Growth in direction requests, calls, and bookings with reliable attribution that reinforces relevance signals to LLMs.
Common Pitfalls
Execution falters when brands treat LPO as a one-off exercise or focus only on rankings. Some of the most common gaps include:
- Reviews managed reactively rather than proactively.
- Slow or inconsistent review responses that erode trust.
- Listings left to decay, creating outdated or duplicate profiles.
- No clear call-to-action strategy, leading to missed conversions.
- Sparse or outdated local content, which signals inactivity to both customers and AI platforms.
These gaps lead to consumer frustration, causing them to choose competitors over your brand. Moreover, such gaps train AI systems to overlook your brand in future recommendations.
Avoiding these pitfalls requires regular cadence, accountability, and a unified framework that connects all four pillars.
Signals of Success
High-performing brands share consistent characteristics:
- Listings that are complete, current, and AI-ready across every platform.
- Optimized websites with local pages.
- A steady stream of reviews with fast, thoughtful responses.
- Local profiles that feel alive, with fresh photos, offers, and community interaction.
- Frictionless calls to action, from booking links to direction requests.
These characteristics are the signals AI platforms and search engines prioritize when deciding which businesses to surface. They’re also the ones that win consumer confidence.
Visibility gives AI systems accurate, structured data they can surface with confidence.
Reputation supplies the trust signals that LLMs use to rank and recommend businesses.
Engagement provides ongoing activity that shows platforms a business is active and relevant.
Conversion generates measurable actions that feed back into algorithms as evidence of value.
Together, these signals create a virtuous cycle where customers find answers they trust, AI systems highlight brands that demonstrate reliability, and businesses benefit from more visits, more conversions, and clearer ROI.
In short, LPO ensures your locations get discovered & chosen by both people & the AI systems shaping discovery.
Industry Comparisons at a Glance
How does your industry compare to others when it comes to Location Performance Optimization? These cross-industry comparisons highlight how each sector is performing on key metrics relating to the pillars of LPO.
Benchmark
Visibility
Industry Visibility Comparison
Average SEO Rank
Healthcare is benefiting from strong SEO alignment, while Restaurants face the most competition and weakest rankings (lower is better).
Industry Visibility Comparison
Recommendation
Restaurant brands should focus on local SEO fundamentals — category alignment, keyword strategy, and rich media — to push into the top 5.
Benchmark
Engagement
Industry Engagement Comparison
Engagement
Retail stands out for engagement, with the industry taking the largest proportion of published posts per location. But most industries underutilize posting features. This reduces freshness signals for AI and consumer perception.
Industry Engagement Comparison
Recommendation
All industries should increase posting cadence. Engaging consumers through localized social media posts could drive bookings, enquiries, and visits. Crucially, it will also signal to AI platforms that your locations are active, increasing the likelihood they’ll be recommended.
Benchmark
Reputation
Industry Reputation Comparison
Reviews Volume
Restaurants have the largest review per location footprint, giving them more social proof but also more to manage. Energy and Healthcare collect fewer reviews, risking weaker trust signals.
Industry Reputation Comparison
Recommendation
Implement consistent review-request workflows to boost volume and credibility. Utilise AI to ensure reviews are requested and managed promptly.
Benchmark
Conversions
Industry Conversions Comparison
Conversions on GBP
To compare industries fairly, we normalized conversions by location and created a Conversion Index, with the top-performing industry set at 1. This highlights the relative strength of each sector in turning visibility into customer actions.
Restaurants set the benchmark for conversions per location, with Energy close behind. Healthcare sits mid-field, while Retail and Hospitality lag significantly.
Industry Conversions Comparison
Recommendation
To lift conversions on the likes of Google Business Profile (GBP), brands should ensure every location profile has clear and compelling calls to action that match real customer intent. Adding direct booking links, menus, or service pages reduces friction and increases action rates. Regularly updating photos, posts, and FAQs keeps profiles fresh, boosting both visibility and consumer confidence. Finally, use UTM tagging and call tracking to monitor which actions drive results, and refine content accordingly.
LPO Spotlight on your industry
Restaurants & Food & Beverage
Restaurants and food businesses, from quick-service outlets to fine dining, are arguably the most competitive sector in local search. Customers are often making fast decisions based on search results, reviews, and convenience.
This makes performance across all four LPO pillars critical.


Restaurants & Food & Beverage
Visibility
Profile Completeness – Restaurants average 85%, but the best hit 100%. Fully complete profiles appear in more searches and inspire consumer confidence.
SEO Rank – Average ranking sits at 12, but leaders are in the top 2. Climbing just a few positions can dramatically increase discovery.

With Uberall, KFC achieved a 132% increase in Google Map Views.


Restaurants & Food & Beverage
Reputation
|
Metric |
Average |
Top Performer |
Lowest Performer |
|---|---|---|---|
|
Average Star Rating |
4.07 |
4.93 |
2.54 |
|
Review Volume Per Brand |
3,313.50 |
311,096.00 |
11.00 |
|
Review Volume Per Location |
41.69 |
3,794.10 |
0.39 |
|
Review Volume Per Location Per Month |
5.96 |
542.01 |
0.06 |
|
Review Response Rate % |
61.20 |
99.56 |
0.00 |
|
Sentiment |
74.42 |
100.00 |
36.88 |
Star Rating – Strong performance across the industry at 4.07, but top brands push beyond 4.9.
Review Volume – Leading brands got 3.3k+ reviews in the period H1 2025. This equates to only around 5.96 reviews per location per month, for the companies in this industry. Clearly, there is an opportunity here for savvy restaurant brands to implement review requesting programs to drive up review volume and improve online visibility and reputation.
Review Response Rate – The best-performing brands and locations respond to almost every review! On average, businesses in this industry are responding to customer reviews more often than not. If you’re not responding to your customers’ reviews, you’re falling behind.
Sentiment – Some restaurant businesses delight every one of their customers to achieve a perfect sentiment score, while others receive more negative sentiment than positive. The industry average suggests the industry is generally doing a good job at making customers happy. Is your restaurant brand leading or lagging behind in this regard?
Restaurants & Food & Beverage
Engagement
|
Platform |
Q4 2024 |
Q1 2025 |
|---|---|---|
|
|
3.80% |
3.90% |
|
|
1.90% |
3.10% |
|
Instagram Reels |
1.70% |
2.60% |
|
X |
1.9% |
2.0% |
|
|
0.90% |
1.3% |
|
Tik Tok |
0.6% |
1.3% |
Regularly posting local social content keeps restaurants top-of-mind for local consumers, fuelling engagement across channels and helping to build a rhythm of interaction with local communities.
Restaurants that adopt a regular local posting cadence by sharing weekly specials, seasonal offers, customer stories, or behind-the-scenes content can stand out quickly in local markets where many competitors are silent.
Source: Critical Truth
Data shown for restaurants, hospitality and tourism.
Restaurants & Food & Beverage
Conversions
|
Metric |
Average |
Top Performer |
Lowest Performer |
|---|---|---|---|
|
Clicks for Directions Per Location |
1,488.31 |
55,428.60 |
17.17 |
|
Clicks to Website Per Location |
1,049.05 |
81,322.73 |
8.42 |
|
Clicks to Call Per Location |
509.66 |
9,667.43 |
0.65 |
Clicks for Directions – On average, each restaurant location generated about 1,488 direction clicks in H1 2025. This reflects strong in-person dining demand, with customers actively seeking places to visit. Performance varied widely: the best-performing location attracted over 55,000 clicks, while the lowest drew fewer than 20. Accurate map listings and up-to-date location details remain essential to capture this intent.
Clicks to Website – A typical restaurant location saw around 1,049 website clicks in H1, often from diners browsing menus, specials, or booking options. The highest performer attracted more than 81,000 clicks per location, compared with fewer than 10 for the lowest. This gap highlights the importance of mobile-friendly, well-optimized websites that make it easy for customers to choose and act.
Clicks to Call – Each restaurant location received an average of 510 calls in H1, as diners phoned to make reservations, confirm hours, or ask about availability. Top-performing locations reached nearly 9,700 calls, while some registered almost none. Ensuring calls are answered promptly — and that profiles list correct numbers — helps convert this steady stream of high-intent inquiries.

With Uberall, Pizzaville achieved a +78% increase in Google Directions clicks.
Hospitality
The hospitality industry covers a wide variety of businesses, including amusement parks, cultural and information centres, gambling and gaming venues, lodgings and resorts, and movie theatres.


Hospitality
Visibility
Profile Completeness – Most hospitality brands do a good job here, averaging 86%. Leaders hit 100%, meaning every possible field is filled. That’s a key driver of discovery.
SEO Rank – On average, businesses appear around 6th place, with the best close to the top position. Even moving up a couple of places can significantly increase visibility.
Hospitality
Reputation
|
Metric |
Average |
Top Performer |
Lowest Performer |
|---|---|---|---|
|
Average Star Rating |
4.16 |
5.00 |
3.06 |
|
Review Volume Per Brand |
1,022.00 |
104,186.00 |
4.00 |
|
Review Volume Per Location |
20.18 |
201.52 |
0.01 |
|
Review Volume Per Location Per Month |
2.88 |
28.79 |
0.00 |
|
Review Response Rate % |
42.67 |
97.60 |
0.00 |
|
Sentiment |
74.21 |
93.36 |
51.43 |
Star Rating – The industry average is strong at 4.16, but some brands still struggling to keep ratings above 3.
Review Volume – Leading brands gathered over 100k reviews, equating to more than 200 per location, while others barely received any. 29 reviews per location per month is the benchmark for locations in this industry.
Review Response Rate – On average, less than half of reviews are answered, signalling that brands in this industry have work to do. The best brands respond to almost all feedback, setting themselves apart.
Sentiment – With an average of 74, sentiment shows guests are generally satisfied, though the gap between best and worst is significant.

Barceló Hotel Group achieved a 95% review response rate with a 2-day average response time.
Hospitality
Engagement
|
Platform |
Q4 2024 |
Q1 2025 |
|---|---|---|
|
|
3.80% |
3.90% |
|
|
1.90% |
3.10% |
|
Instagram Reels |
1.70% |
2.60% |
|
X |
1.9% |
2.0% |
|
|
0.90% |
1.3% |
|
Tik Tok |
0.6% |
1.3% |
Local recommendations, special packages, or guest experiences bring destinations to life. Regular engagement provides a clear advantage in discovery and shaping consumer choices. While the low levels of post-publishing here are not representative of the global hospitality industry as a whole, there is nevertheless an opportunity to lead the way.
Source: Critical Truth
Data shown for restaurants, hospitality and tourism.
Hospitality
Conversions
|
Metric |
Average |
Top Performer |
Lowest Performer |
|---|---|---|---|
|
Clicks for Directions Per Location |
4,212.85 |
20,981.75 |
3.39 |
|
Clicks to Website Per Location |
2,796.16 |
56,819.59 |
0.02 |
|
Clicks to Call Per Location |
244.96 |
4,313.88 |
0.02 |
Clicks for Directions – Hospitality locations generated a median of 4,213 direction clicks in H1 2025, showing strong customer intent to visit venues in person. The highest-performing locations attracted over 20,000 clicks, while some barely registered any. This range underlines the need for accurate addresses, map pins, and local details to capture travel-related searches.
Clicks to Website – Each hospitality location typically received around 2,796 website clicks, as travelers explored booking options, amenities, and offers. The top performers drew more than 56,000 clicks per location, while some received virtually none. This stark gap highlights how crucial it is for hospitality brands to invest in fast, mobile-friendly sites with clear booking paths.
Clicks to Call – Hospitality locations generated a median of 245 calls per location, often from guests confirming reservations, asking about availability, or requesting special arrangements. The best performers handled over 4,300 calls per location, while some barely registered a single call. Accurate phone details and well-trained staff ready to handle these inquiries can turn this demand into bookings.
Retail
The retail industry is one of the broadest categories in our dataset, covering 38 sub-industries. It includes consumer electronics, fashion, telecoms, supermarkets, department stores, home improvement, sports equipment, and many other forms of physical retail, excluding restaurants, auto dealers, and medical services.


Retail
Visibility
Profile Completeness – Retailers are strong here, averaging 89%, with the best hitting 100%. Complete profiles show up more often in searches and inspire trust.
SEO Rank – On average, retailers sit around position 6.6 in Google results, but leaders are effectively in first place. Even small ranking improvements can mean a huge boost in discovery.

With Uberall, Schuh achieved a 99% profile completeness across all stores.
Retail
Reputation
|
Metric |
Average |
Top Performer |
Lowest Performer |
|---|---|---|---|
|
Average Star Rating |
4.16 |
5.00 |
2.13 |
|
Review Volume Per Brand |
809.00 |
665,605.00 |
4.00 |
|
Review Volume Per Location |
7.96 |
444.71 |
0.12 |
|
Review Volume Per Location Per Month |
1.14 |
63.53 |
0.02 |
|
Review Response Rate % |
56.41 |
100.00 |
0.00 |
|
Sentiment |
76.96 |
100.00 |
35.53 |
Star Rating – The retail sector performs well overall, averaging 4.16 stars, with some brands achieving the perfect 5.
Review Volume – Leading brands collected over 600k reviews, with top-performing locations achieving over 60 reviews per month. The average review volume per location per month is very low, presenting an opportunity for savvy brands to implement a review-requesting initiative across locations.
Review Response Rate – Just over half of reviews get a reply, while the top performers respond to all.
Sentiment – At nearly 77, most retailers are satisfying customers, though some brands fall far behind.
Retail
Engagement
|
Platform |
Q4 2024 |
Q1 2025 |
|---|---|---|
|
|
3.90% |
3.90% |
|
|
1.80% |
3.0% |
|
Instagram Reels |
2.10% |
2.40% |
|
X |
1.6% |
1.6% |
|
|
0.9% |
1.7% |
|
Tik Tok |
1.2% |
1.0% |
Retailers that consistently post about new arrivals, limited-time promotions, or local store events can quickly become more discoverable. In categories where most competitors rarely update their profiles, even modest activity makes a brand feel relevant and top-of-mind.
Source: Critical Truth

With Uberall, Sunmed chieved 7.2 million Facebook impressions across all locations through the use of Uberall’s social writer.
Retail
Conversions
|
Metric |
Average |
Top Performer |
Lowest Performer |
|---|---|---|---|
|
Clicks for Directions Per Location |
710.18 |
22,094.62 |
0.00 |
|
Clicks to Website Per Location |
484.62 |
20,834.92 |
0.00 |
|
Clicks to Call Per Location |
218.60 |
5,424.50 |
0.00 |
Clicks for Directions – Retail locations saw an average of 710 direction clicks per location in H1 2025, reflecting steady in-store shopping demand. The highest-performing locations attracted more than 22,000 clicks, while some recorded none at all. This wide spread underscores how critical accurate addresses, map pins, and opening hours are for converting local search intent into store visits.
Clicks to Website – A typical retail location generated about 485 website clicks, as shoppers browsed product ranges, promotions, or store information online. Top performers drew over 20,000 clicks per location, compared with zero for the lowest performers. Brands that prioritize fast, mobile-friendly websites with clear product and store details are far more likely to capture this online research activity.
Clicks to Call – On average, each retail location handled around 219 calls in H1, from customers confirming stock, checking hours, or asking about services. Leading locations saw more than 5,400 calls, while others had none. This suggests that for many customers, the phone remains an important touchpoint and ensuring calls are answered promptly can directly influence conversion.
Healthcare
The healthcare industry spans a diverse set of services, from elderly care homes and hospitals to medical labs, imaging centres, physicians’ clinics, specialists, and mental health and rehabilitation providers. For these organisations, digital presence is critical as patients and families often make care decisions online before ever setting foot in a facility.


Healthcare
Visibility
Profile Completeness – Healthcare providers are strong here, with an average score of 93%. Top brands have fully complete profiles, helping them appear in more searches and instilling confidence in patients.
SEO Rank – On average, healthcare businesses rank around 4th position in Google, with leaders effectively in the top two spots. That visibility is often the difference between being chosen or overlooked.


Healthcare
Reputation
|
Metric |
Average |
Top Performer |
Lowest Performer |
|---|---|---|---|
|
Average Star Rating |
4.12 |
4.89 |
2.22 |
|
Review Volume Per Brand |
405.00 |
24,638.00 |
5.00 |
|
Review Volume Per Location |
4.68 |
26.24 |
0.03 |
|
Review Volume Per Location Per Month |
0.67 |
3.75 |
0.00 |
|
Review Response Rate % |
61.71 |
99.55 |
0.00 |
|
Sentiment |
74.39 |
98.14 |
28.57 |
Star Rating – The industry averages just above 4.1 stars, though top performers get close to 4.9.
Review Volume – Big networks generate tens of thousands of reviews, but many smaller practices attract very few. The best performing healthcare location sees only around 4 reviews per month.
Review Response Rate – On average, 62% of reviews get a response, though the best respond to nearly all.
Sentiment – The industry performs well overall, but gaps remain: some providers delight nearly every patient, while others score far lower.
Healthcare
Engagement
|
Platform |
Q4 2024 |
Q1 2025 |
|---|---|---|
|
|
2.80% |
3.30% |
|
|
1.60% |
3.7% |
|
Instagram Reels |
1.3% |
2.7% |
|
X |
1.3% |
2.3% |
|
|
1.3% |
1.9% |
|
Tik Tok |
1.0% |
1.0% |
Healthcare providers that publish simple updates, like seasonal health tips, vaccination reminders, or community outreach initiatives, signal accessibility and care to humans and activity and relevance to machines. In an industry where digital engagement is often limited, these small actions make practices feel approachable and trustworthy.
Source: Critical Truth
Healthcare
Conversions
|
Metric |
Average |
Top Performer |
Lowest Performer |
|---|---|---|---|
|
Clicks for Directions Per Location |
519.57 |
1,507.25 |
6.41 |
|
Clicks to Website Per Location |
530.65 |
3,220.30 |
3.10 |
|
Clicks to Call Per Location |
334.34 |
2,011.99 |
4.89 |
Clicks for Directions – Healthcare locations generated an average of 520 direction clicks per location in H1 2025, reflecting strong demand for in-person visits to clinics, practices, and other facilities. The top performers saw over 1,500 clicks, while some recorded as few as 6. This highlights the importance of accurate maps, addresses, and directions so patients can easily find the care they need.
Clicks to Website – On average, healthcare locations received about 531 website clicks, with the best performers attracting more than 3,200. At the low end, some recorded virtually no clicks. Patients often go online to check services, insurance coverage, or appointment availability meaning clear, user-friendly websites are essential for trust and patient acquisition.
Clicks to Call – Each healthcare location handled an average of 334 calls in H1, typically from patients confirming appointments, asking about services, or checking opening hours. The top-performing locations managed over 2,000 calls, while others logged fewer than 5. Ensuring phone numbers are correct and staff are prepared to answer promptly can make the difference between gaining or losing a patient.

With Uberall, Resmed achieved 11% more website clicks.
Energy
The energy sector includes a wide mix of businesses, from electricity providers and oil & gas companies to utilities, renewable energy firms, and EV charging point operators. For these industries, customer experience is increasingly digital-first — consumers search online for nearby charging stations, compare providers, and leave reviews that influence public trust.


Energy
Visibility
Profile Completeness – Energy companies average 85%, with top players hitting a full 100%. Complete listings mean more visibility in search and maps.
SEO Rank – On average, brands rank around position 6, while leaders are effectively first place. Lagging companies sit much lower, around position 23, missing out on consumer intent.


Energy
Reputation
|
Metric |
Average |
Top Performer |
Lowest Performer |
|---|---|---|---|
|
Average Star Rating |
3.67 |
4.61 |
2.67 |
|
Review Volume Per Brand |
4,533 |
64,364 |
3 |
|
Review Volume Per Location |
4.58 |
49.06 |
0.03 |
|
Review Volume Per Location Per Month |
46.13 |
100.00 |
0.00 |
|
Review Response Rate % |
60.10 |
91.28 |
27.27 |
|
Sentiment |
3.67 |
4.61 |
2.67 |
Star Rating – The sector struggles here, averaging 3.67 stars — lower than most other industries. Top performers push above 4.6, showing what’s possible.
Review Volume – Leading brands have tens of thousands of reviews, while others generate almost none. At the location level, the typical energy brand receives around 5 reviews.
Review Response Rate – Less than half of reviews get a response on average. However, the best firms respond to every customer.
Sentiment – Consumer sentiment is mixed, averaging just 60, with some providers falling as low as 27. Trust is fragile in this space.


With Uberall, Total Energies achieved a +83% boost in reviews.
Energy
Engagement
|
Platform |
Q4 2024 |
Q1 2025 |
|---|---|---|
|
|
3.7% |
3.8% |
|
|
3.6% |
3.8% |
|
Instagram Reels |
3.4% |
3.3% |
|
X |
2.6% |
2.4% |
|
|
1.6% |
2.0% |
Brands in this industry that post about initiatives, service updates, or local community projects demonstrate reliability and connection to the communities they serve, as well as relevance to machines. With many competitors silent, consistent updates are an even more potent method of building trust and strengthening local presence.
Source: Critical Truth
Energy
Conversions
|
Metric |
Average |
Top Performer |
Lowest Performer |
|---|---|---|---|
|
Clicks for Directions Per Location |
262.46 |
2,789.21 |
119.06 |
|
Clicks to Website Per Location |
15.00 |
957.04 |
1.98 |
|
Clicks to Call Per Location |
3.66 |
243.14 |
0.17 |
Clicks for Directions – Locations in this industry received an average of 262 direction clicks per location in H1 2025. The highest-performing locations saw nearly 2,800 clicks, while the lowest still recorded more than 100. This reflects the importance of being findable in maps when customers are on the move and making immediate decisions about where to refuel or recharge.
Clicks to Website – On average, energy locations attracted only 15 website clicks per location. While top performers reached close to 1,000, some had barely any. This suggests that websites are a much less common touchpoint in this sector compared with others, as customers prioritize speed and convenience over online research. Still, optimized websites can help with loyalty programs, pricing information, or service updates.
Clicks to Call – Calls were the least frequent conversion type, averaging just 4 calls per location. The top locations managed around 240 calls, while some registered almost none. Although calling isn’t a primary behavior in this category, ensuring accurate phone details can still be valuable for customers needing support with services, facilities, or emergencies.


Agrola achieved 70% more conversions with Uberall.
From Benchmark to Action: How to Improve Location Performance Across Industries
The data shows wide variation across industries, but the best-performing brands share common practices. These actions form a playbook that any multi-location business can apply to strengthen visibility, reputation, engagement, and conversions.
Visibility: Be Found Everywhere That Matters
Top performers go beyond the basics of listings and ensure their profiles are rich, accurate, and up to date. Three priorities stand out:
- Menus & Services: Add detailed menus, service lists, or product catalogs to help customers (and algorithms) understand what each location offers.
- Photos & Videos: Upload high-quality, fresh imagery that showcases locations and builds trust.
- Attributes & Local Details: Highlight features like parking, delivery options, or accessibility to give customers confidence to choose.
- Local Pages: Build dedicated, optimized pages for each location on your website. These pages reinforce your visibility in search, support AI discovery, and give customers a trusted place to confirm details beyond third-party listings. Recommended resource: 10 Tips to Optimize Your Google Business Profiles
Reputation: Build Trust Through Reviews
Customer reviews are one of the strongest signals for visibility and choice. Leading brands prioritize both volume and authenticity.
- Generate More Reviews: Encourage customers to leave reviews — via post-purchase emails, QR codes on receipts, or staff asking in person.
Recommended resource: How to Ask Customers for Reviews - Respond with Balance: Combine human responses with AI or templates to scale efficiently without losing authenticity.
Recommended resource: AI Bulk Replies in Action - Manage Negatives: Have a playbook for handling negative or fake reviews to protect brand trust.
Recommended resource: How to Respond to Negative Reviews (Templates Included)
Engagement: Show Up as Active & Relevant
Algorithms reward activity, and customers notice it too. High performers treat engagement as an always-on activity.
- Posts with a CTA: Share updates that drive action, whether it’s “Order now,” “Book today,” or “Find out more."
- Leverage Google and Apple: Prioritize Google Business Profiles and Apple Maps updates — the two biggest discovery platforms. Recommended resource: Apple Maps vs Google Maps: What’s Better for Your Business?
- Local Relevance: Complement national campaigns with local updates, such as events or seasonal offers, to connect more closely with nearby customers.
Engagement represents a significant opportunity for brands. As AI systems evolve, they will increasingly rely on fresh, localized signals to validate brand activity. Brands that act now will be positioned as leaders in this shift. Act now to boost local engagement through social and reap the rewards!
Recommended resource: How to Boost Visibility in AI Search Through Social
Conversions: Turn Visibility into Action
Strong visibility, reputation, and engagement create demand, but conversions determine whether that demand results in real outcomes.
- Ensure click-to-call, directions, and booking links are easy to find and work flawlessly.
- Track which channels drive the most conversions to focus investment where it matters.
Recommended resource: Future of Search: How We Used GEO Initiatives to Increase Brand Engagement and Clicks in 1 Month
Thrive in the AI Era
Location Performance Optimization (LPO) provides the system to achieve this. The four pillars of visibility, reputation, engagement, and conversion guide brands in building strong local profiles that are trusted by people and prioritized by machines. Together, they form the foundation for local success in an environment where discovery happens across both traditional and emerging channels.
The opportunity is clear.
Brands that embed LPO as an ongoing discipline will capture more customers, build resilience across all discovery platforms, and strengthen their competitive advantage. The next stage of growth belongs to those who act now.
TLDR;
LPO is the framework that will define which brands thrive in the AI-first economy & remain relevant wherever customers choose to search.
About This Report
This report is based on aggregated, anonymized data from Uberall’s global customer base across a range of industries. The analysis generally draws on performance data from the first half of 2025 (H1 2025), measured across the four pillars of Location Performance Optimization (LPO): visibility, reputation, engagement, and conversions.
The metrics highlighted are selected from those most relevant to LPO maturity, including location data quality, customer review activity, and local engagement signals. These serve as benchmarks to illustrate how brands are performing at an industry level, rather than at a regional or individual business level. For example, the restaurant and food & beverage insights reflect Uberall customers worldwide in that industry, not a single market.
While the findings provide a useful view into performance trends, they are not exhaustive. Results should be treated as directional benchmarks—intended to guide thinking and highlight areas of opportunity—rather than definitive measures of any industry as a whole.
How Uberall Can Help
Uberall is the only platform built for Location Performance Optimization. It transforms the four pillars of LPO into a repeatable and trackable system:
- Visibility: Manage listings across the full network with structured, AI-ready data that fuels discovery.
- Reputation: Monitor and respond to reviews at scale with workflows and sentiment analysis that protect and grow trust.
- Engagement: Keep profiles alive through posts, updates, images, and FAQs that show customers and algorithms your brand is active.
- Conversion: Track and optimize clicks, calls, bookings, and other actions that turn visibility into measurable revenue.
Take Action: Take our assessment to reveal your company's LPO Maturity and receive personalized recommendations to improve your local search performance.
Report Benchmarks
Engagement Benchmarks
Engagement Rate
- The percentage of interactions (likes, comments, shares, clicks, saves, etc.) a brand receives relative to its audience size. It measures how actively customers engage with published content. In this report, we show the mean engagement rate for each industry.
- SEO Ranking
- This metric represents ranking position in Google’s Search Engine Results Page (SERP). A ranking of 1-3 indicates top performance (Google Map Pack), 4-10 is good but not Map Pack, and 10+ suggests not visible on Google's first page. Average (mean) SEO Ranking scores are shown at a brand level.
Reputation Benchmarks
Average Star Rating
- The mean customer review score across a brand’s locations, on a scale of 1–5 stars.
Review Volume Per Brand
- The median number of reviews received by a brand. The median is used to balance differences in brand size, since very large chains with hundreds or thousands of outlets naturally generate more reviews than smaller brands. For enterprise businesses especially, this provides a fairer picture of typical review activity across the network, without results being distorted by the very largest or smallest brands
Review Volume Per Location
- The average number of reviews each location receives. The average is used here to reflect the overall level of customer activity at an outlet level. This metric helps brands see whether review activity is evenly distributed across their footprint and spot locations that may be underperforming in attracting customer feedback.
Review Response Rate %
- The percentage of customer reviews that a brand responds to. The mean average is shown for industries in this report.
Sentiment
- A score out of 100 that shows how customers feel in their reviews. Using natural language processing, reviews are analyzed to see if the tone is mostly positive, neutral, or negative. In this report, we show the mean sentiment score for each industry.
Review Volume Per Location Per Month
- The median number of reviews each location receives per month. The median is used to smooth out spikes from unusually busy outlets and show a more representative flow of reviews across the footprint. For enterprise brands, this metric highlights whether locations are consistently generating fresh customer feedback, which is key for visibility, trust, and ranking in search.
Conversion Benchmarks
Clicks for Directions Per Location
- The number of times users clicked to get directions to a location, reflecting offline visit intent.
Clicks to Website Per Location
- The number of clicks leading from a listing to the brand’s website, indicating online engagement and information-seeking.
- Clicks to Call Per Location
- The number of click-to-call actions from listings, a strong signal of direct customer intent to engage with a location.
All average conversion metrics for industries are shown as a median average unless otherwise stated.
Visibility Benchmarks
Profile Completeness
SEO Ranking